
Executive Summary
The innovation capacities of places are a key driver of long-term economic performance in the United States, other advanced nations, and emerging nations. The states and regions who invest in and nurture innovative activities and build human capital will establish ecosystems that create high-paying jobs for their citizens and attract migrants from other states and nations, boosting economic growth further. This paper evaluates the American Heartland’s position in the innovation economy relative to the rest of the country. We identify key strengths, but also identify gaps that should be narrowed through the development and implementation of thoughtful, well-articulated public policy.
This analysis demonstrates that there are unrevealed or unrecognized innovation strengths in the American Heartland. However, many opportunities currently exist to improve its economic position. In order to close the divergence in performance between the Coasts and the American Heartland; it must participate more fully in the innovation-driven economy of the 21st Century.
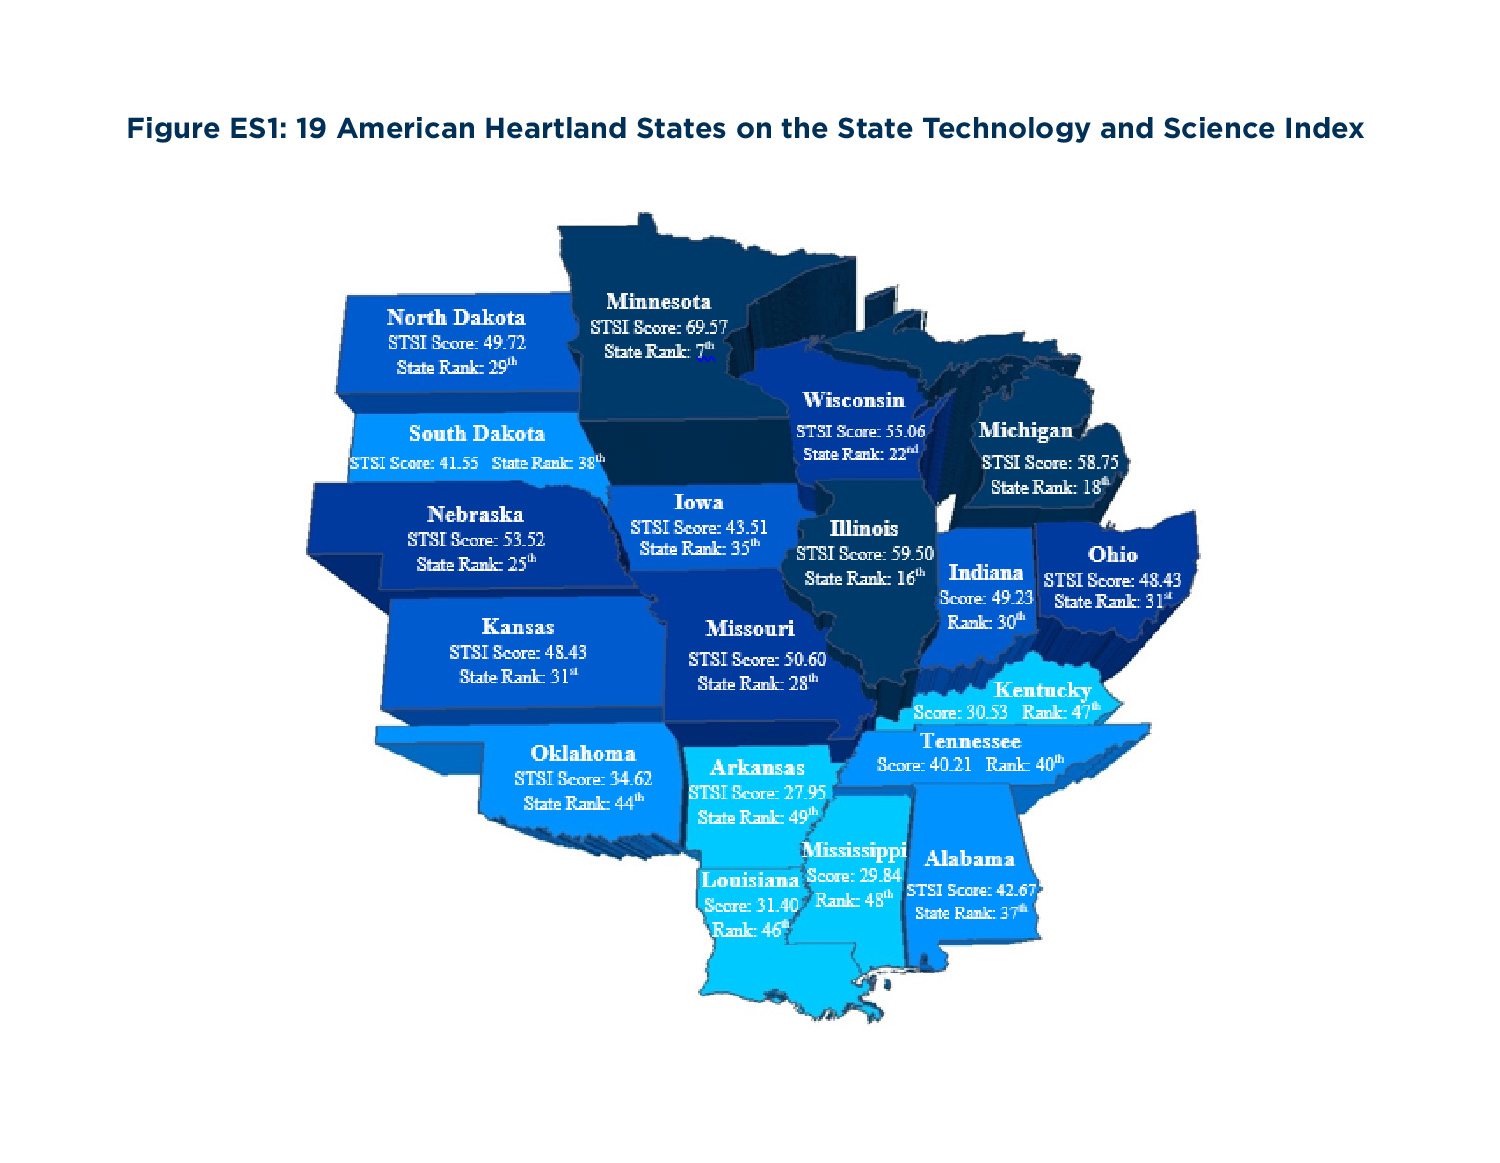
In developing an evaluation of the 19 states included in the American Heartland (see Figure ES1), we utilized the Milken Institute’s State Technology and Science Index (STSI),1 supported by the State New Economy Index published by the Information Technology & Innovation Foundation. 2 The two indices are the most widely used measures showing how states are positioned for participation in an environment of innovation-driven economic growth. The lead author of this report, with support from his former colleagues at the Milken Institute, developed the STSI in 2002. The efficacy of the STSI is demonstrated in its ability to explain 75 percent of the difference in real technology-related GDP per capita and two-thirds of income per capita of the working-age population between the 50 states.
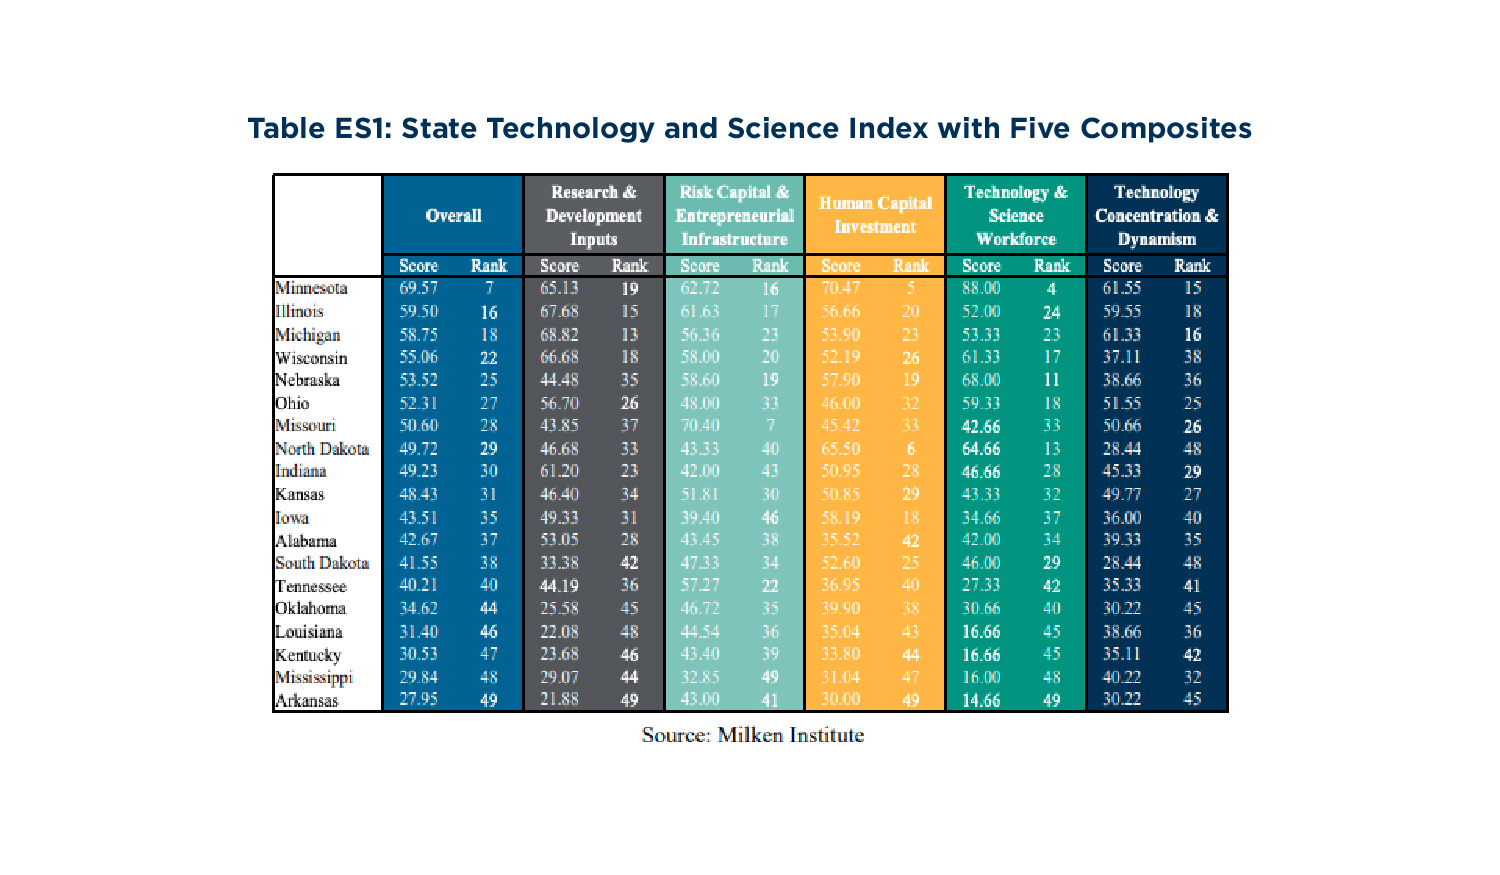
The STSI includes 107 individual metrics that segment into five subcategories to benchmark where states are positioned on innovative activities. All metrics are normalized relative to some benchmark such as population, gross state product (GSP) or other measures to adjust for the size of each state’s economy. The five composites include 1) Research and Development Inputs, 2) Risk Capital and Entrepreneurial Infrastructure, 3) Human Capital Investment, 4) Technology and Science Workforce and 5) Technology Concentration and Dynamism (please see the Introduction section for a more thorough description).
American Heartland Overview
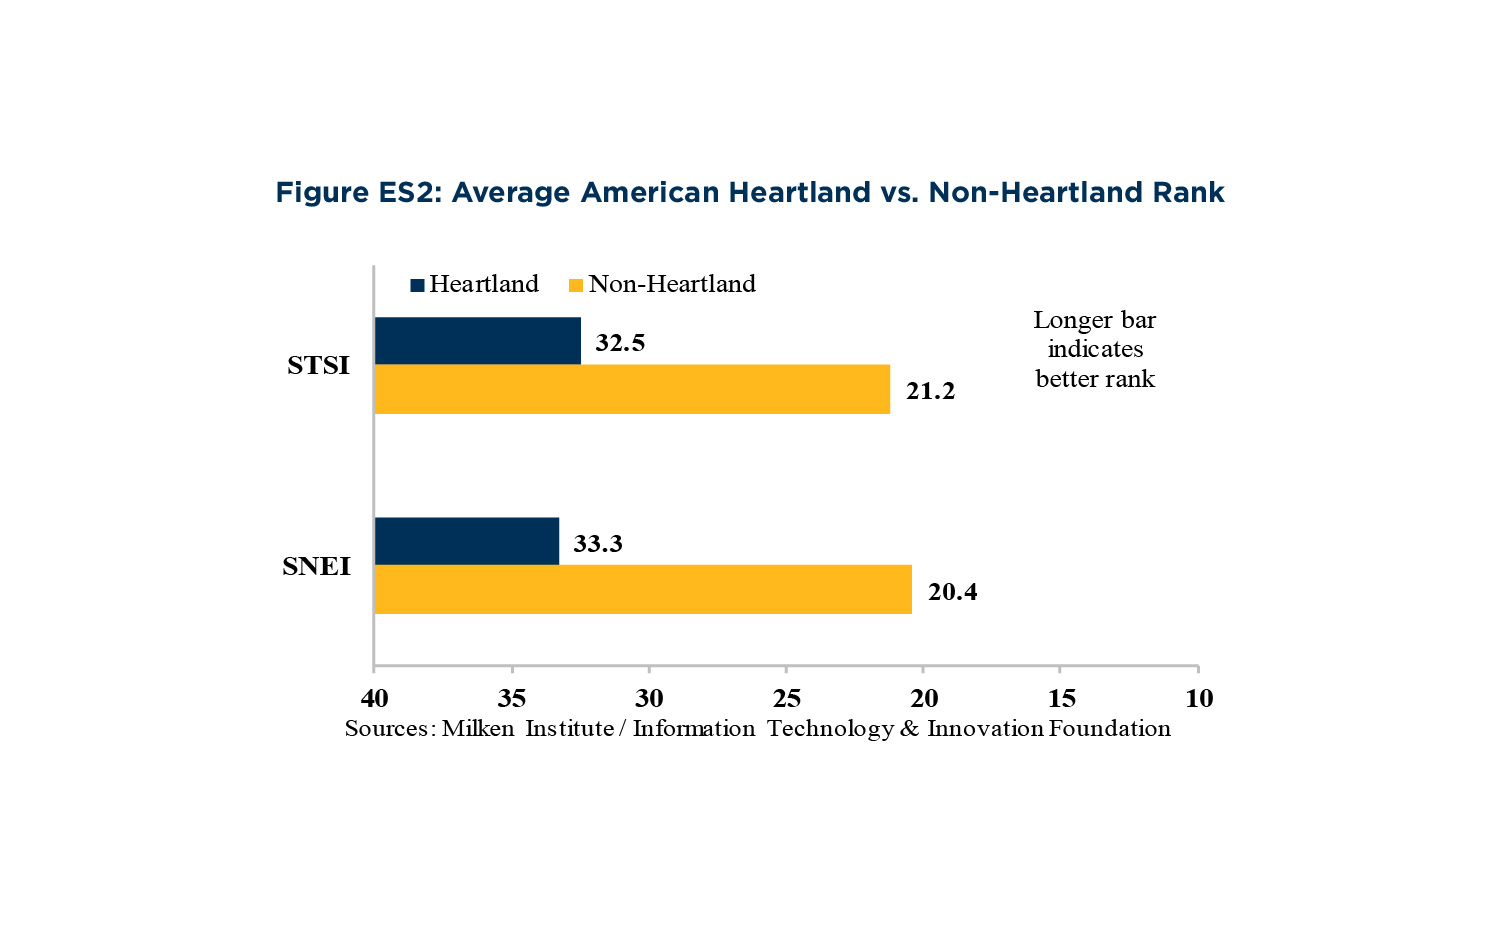
The average rank of the 19 American Heartland states on the STSI was 32.5. The number indicates the Heartland is about seven positions below the mean for the nation. Another way to view this relationship is that the 31 non-Heartland states have an average rank of 21.2. On the State New Economy Index (SNEI), the Heartland states have an average rank of 33.3 which is indicative of consistent evaluation with the STSI overall (see Figure ES2). However, the general positioning of the Heartland masks some exemplary performances among several states. For example, at seventh overall in the STSI, Minnesota is the best-scoring Heartland state in measures of preparedness and participation in the innovation economy. Minnesota’s latest STSI score resulted in a five-position improvement from where it was in 2014. Illinois (16th), Michigan (18th), Wisconsin (22nd) and Nebraska (25th) all were in the top half of states.
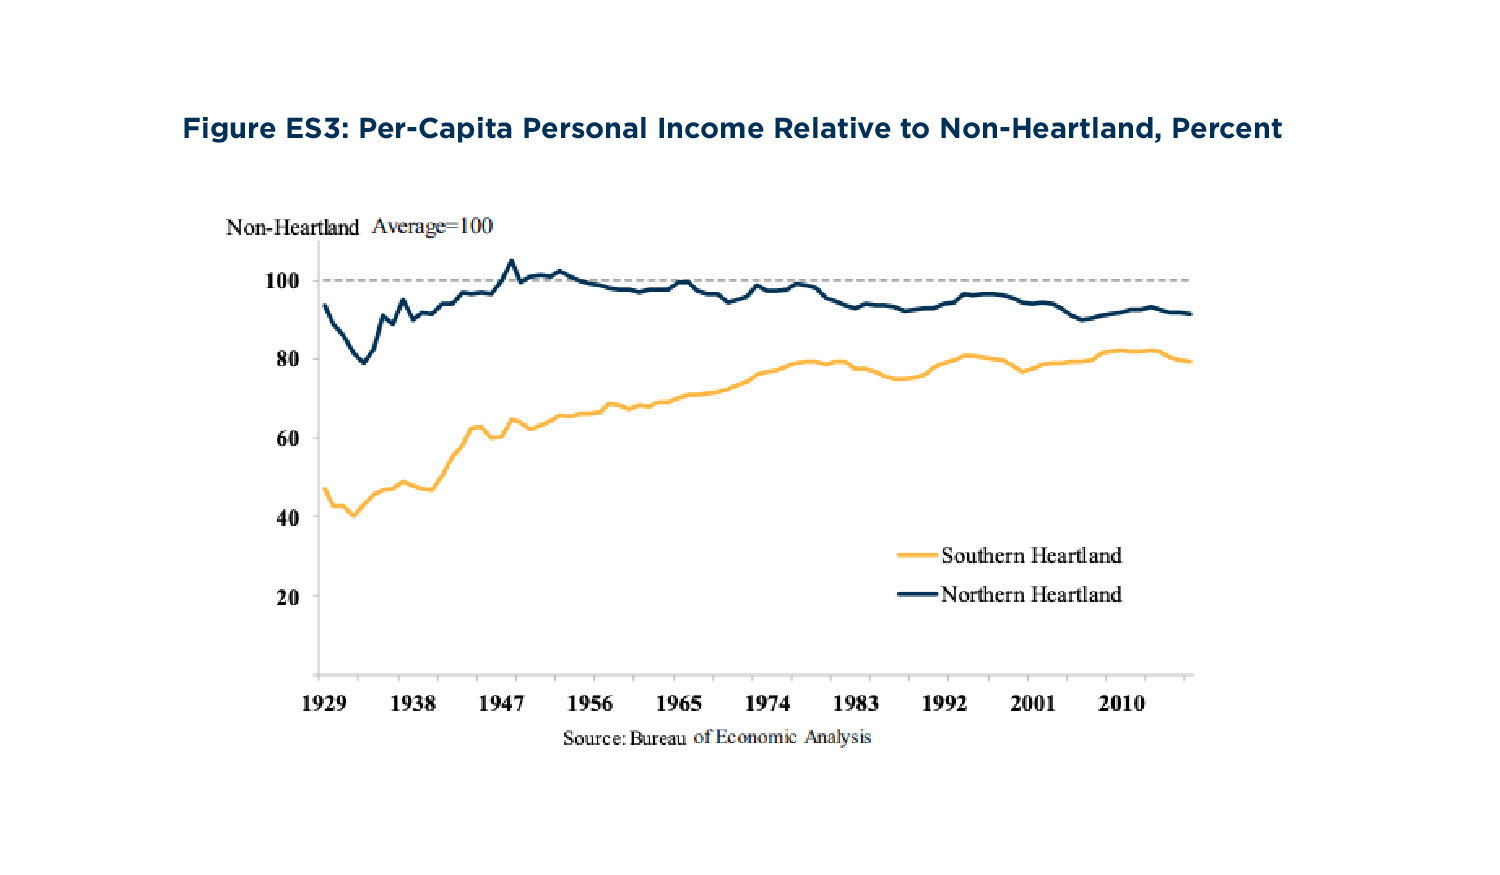
There is a clear separation between the northern and southern sections of the Heartland in preparedness to compete in the innovation economy. The average rank of the 12 states in the northern section was 25.5 versus 44.4 in the seven southern states. Five states (Oklahoma, 44th; Louisiana, 46th; Kentucky, 47th; Mississippi, 48th; and Arkansas, 49th) are in the bottom ten. This divergence has been in place since the North began to industrialize. The southern American Heartland states did not maintain critical investment during the financial crisis and the aftermath of the Great Recession, which devastated state revenues.
While the southern section of the Heartland has been narrowing the gap in per capita income with the rest of the nation for many decades, progress has stalled primarily due to the lack of fuller participation in innovation-driven economic activity (see Figure ES3). Additionally, there are rural pockets that do not have much involvement in high-value-added economic activity due to lingering intergenerational legacies stemming from interrelated low educational attainment, poverty, unhealthy behaviors and high rates of chronic disease. The mechanization of agriculture and low-value-added manufacturing have harmed labor market participation too. The nonmetropolitan populations of the southern Heartland represent a larger proportion of the region’s total population, providing them with fewer opportunities to have critical innovation assets such as research universities or federal laboratories that can be leveraged to promote economic growth. Scale does bestow economic advantages in concentrating on innovative endeavors but does not obviate the responsibility to invest in regions with less density and fewer initial endowments.3
Within the five composites that comprise the STSI, there were several kernels of strength and recent improvements in the American Heartland (see Table ES1).
1. Research and Development Inputs
In research and development (R&D), Michigan is the top-ranked Heartland state at 13th, and has seen steady advances on its score; rising from 54.39 in 2002 to 68.82. Michigan has enacted some of the most well-articulated policies in the country to enhance its future position in the innovation economy. Michigan-based firms have a long history of working with universities and a prime example is the University of Michigan ranking 16th in the nation on measures of commercialization.4 Michigan is seventh in the nation in industrial R&D. Illinois rose five places in the overall STSI score since 2014—mainly attributable to a 6.8-point advance in R&D. A critical asset for Illinois in innovation is its strong bi-directional and cross-collaboration between universities, industry, and the state’s two national labs, Argonne and Fermilab.
Wisconsin recorded one of the most substantial improvements in R&D in the nation since 2002 when the first STSI rankings were released: its score rose to 66.68 from 46.58—a noteworthy gain in rank of nine. Advances in academic R&D, coupled with a first-place national ranking in R&D in biomedical sciences, bolstered Wisconsin’s standing. Indiana’s score in R&D increased partly due to Purdue’s rising stature in commercialization and the state’s robust national ranking of 11th in industrial R&D. Even states not widely known for strong R&D performance exhibit encouraging trends. For example, Arkansas experienced gains in attracting more Small Business
Technology Transfer programs (STTR) and Small Business Innovation Research (SBIR) phase I awards where it came in 17th and 27th, respectively. These are prestigious programs and demonstrate the state is developing intellectual property that has commercial potential. Tennessee is 13th in federal R&D, aided by its national laboratories, punching in above weight in this category.
2. Risk Capital and Entrepreneurial Infrastructure
Missouri is the strongest performer in risk capital and entrepreneurial infrastructure at seventh, a 24-place leap from where it stood in 2014. There are more flow measures in this indicator as opposed to stock measures. One notable improvement within the category was the number of companies receiving venture capital investment relative to total businesses; eighth overall. Clearly, a direct connection with the state’s strategic plan. One of Nebraska’s most significant gains occurred in risk capital and entrepreneurial infrastructure where the state now ranks 19th. The latest score was a remarkable 31-point improvement from 2012. Nebraska ranks 17th in venture capital investment as a percent of GSP.
Wisconsin experienced a sizeable improvement since 2014, rising by 16 positions. The state’s most impressive gains were in access to venture capital. Kansas came in second for the increase in the number of companies receiving venture capital and ninth in green tech investments. Surprising to some, but not to officials in Alabama, the state jumped to third from 44th in 2014 in total venture capital investment growth. Kentucky was first in total venture capital investment growth, displaying an encouraging sign for future advances in fast-growing companies.
3. Human Capital Investment
Minnesota placed fifth in human capital investment—tops in the Heartland. The state ranked tenth in the percent of the adult population with a Bachelor’s Degree or higher. On future workforce preparedness, Minnesota stood second in the proportion of graduate students that are in science, engineering or health. However, North Dakota saw the most notable improvement in human capital investment where the state climbed to sixth from 12th in 2014. North Dakota was first in recent Bachelor’s Degrees in science and engineering per 1,000 civilian workers and fifth for PhDs awarded in science, engineering and health. Many of the recent year gains are attributable to the growing demand for petroleum engineers related to technological advances in horizontal drilling techniques and the boom in shale oil exploration.
South Dakota improved to 25th in human capital investment from 30th in 2014. Notable performances were recorded in science, engineering, and health PhDs awarded among people aged 25-34 (third) and recent Bachelor's Degrees in science and engineering (sixth). Oklahoma rose four positions in human capital investment from 2014. Encouraging signs are seen in Oklahoma being 26th in recent Master’s Degrees in science and engineering, and 30th in recent Bachelor’s Degrees in the same category. Louisiana improved its rank by three since 2014. Strength was exhibited in recent Degrees in science and engineering where it was 17th.
4. Technology and Science Workforce
In technology and science workforce, Heartland’s highest score of 88.00 came from Minnesota, which placed fourth. This was a 17-point improvement from its seventh-place finish in 2014, eclipsing California and only behind Maryland, Massachusetts and Colorado. Given the state’s industry composition, it should not come as a surprise that Minnesota’s strength in technology and science workforce is highest in occupations in life sciences and areas of engineering. Minnesota was second in the intensity of biomedical engineers; third in biochemists and biophysicists; third in materials scientists; fourth in life scientists; tenth in medical scientists; second in industrial engineers and tenth in mechanical engineers. Nebraska was 11th in technology and science workforce, landing it just out of a top-ten ranking. Nebraska’s success is due to a strong performance in a number of occupational categories comprised of computer and information sciences. North Dakota witnessed a leap of 34 positions from 2014 to 13th in the latest reading. North Dakota was fifth in the intensity of mining and geological engineers and seventh in petroleum engineers.
Ohio climbed 12 places from 2014 to 18th overall in technology and science workforce. Ohio was fourth in material scientists; fifth in computer network support specialists; sixth in industrial engineers; seventh in aerospace engineers, chemical engineers and mechanical engineers and ninth in chemists, displaying its prowess in key engineering occupations. Indiana rose four places in the latest reading, holding first in the intensity of material engineers and fourth for the intensity of mechanical engineers. Illinois was sixth in nuclear engineers and seventh in physicists courtesy of its two national labs. Despite a weak score overall, Arkansas was fourth in agricultural
and food science technicians. With strengths in rice and protein production, Arkansas remains among the national leaders in food and agricultural science. However, technology and science workforce is where the southern section of the American Heartland has its lowest participation.
5. Technology Concentration and Dynamism
Minnesota was 15th in technology concentration and dynamism, a gain of five positions since 2014. Minnesota’s advance was attributable to an improvement to ninth in the number of Inc. 500 firms. Within this category, Michigan had the most significant gains, rising by 14 places and 12.2 points from 2014. Even more extraordinary, Michigan jumped from 46th in 2010, the largest jump of any state. An excellent example of the tremendous gains was in the net formation of high-tech establishments relative to total business establishments where it rose from 48th in 2010 to ninth in 2016. Over the past ten years, the New Economy Initiative (NEI) focused on the Detroit metropolitan area supporting inclusive entrepreneurial programs and diversification of the economy.
Mississippi recorded its highest score in technology concentration and dynamism placing 32nd, a gain of 18 places from 2004, attained by adding fast-growth technology firms. Ohio improved to 25th in this category. As recently as 2008, Ohio was 48th on this outcome measure. Ohio was first in the nation in average yearly growth in high-tech industries over a five-year period. Further, Ohio was sixth in the net formation of high-tech establishments per 10,000 business establishments. Cleveland Clinic Innovations, the commercialization arm of the Cleveland Clinic, has spun off nearly 80 companies since 2000, including Cleveland HeartLab. Iowa moved up two positions
and Tennessee four from 2014, rising to 17th in net formation of high-tech establishments.
Leading Public Policy Initiatives
Nebraska Governor Pete Ricketts advocates policy ideas to improve tech connections to rural areas of the state. The Library Innovation Studios project was initiated to improve the availability of makerspaces and access to technology tools to encourage creativity and promote entrepreneurship. This is an increasing trend among policymakers around the nation attempting to broaden access to the innovation economy. The University of Tennessee System added initiatives to its strategic plan in 2015 that focus on funding the development of university research into marketable products and developing research partnerships with private companies.
Governor Mark Dayton and the Legislature are improving access to early-stage financing through Minnesota’s Angel Tax Credit program. The program provides tax credits to investors or funds that invest in startups in high technology. Since the program started in 2010, over 400 businesses and startups have collected over $370 million in investment. Wisconsin utilized tax incentives to recruit Taiwan’s Foxconn Technology Group Inc., a major supplier of Apple, to create a $10 billion megaplant. The hope is that 13,000 technology-manufacturing jobs will be created for Wisconsin workers and to help attract skilled labor from outside the state.
Arkansas Governor Hutchinson has implemented a new program to build the science and technology workforce: ArFuture grants, enable the state to pay for all tuition and mandatory fees for individuals to attend a two-year college program or technical school in the pursuit of a high-need job skill or degree. This will be a crucial test for how southern Heartland states can improve their position through a bootstrapping approach. Missouri’s 2011 strategic plan for economic development serves as strong policy evidence. The plan focused on growing several STEM fields and training workers. More than 57,000 individuals received training in the first five years. Michigan
Governor Snyder unveiled a new program to address challenges in STEM education called the “Marshall Plan for Talent.” This extensive plan targets investments through a three-pronged approach: K-12 education, higher education and the state’s existing workforce. It includes funding for apprenticeship programs and tech-directed tuition assistance.
The Illinois Innovation Network and the Discovery Partners Institute, located at the University of Illinois, are state programs launched to better partner university research with entrepreneurship. The diverse relationship leads to higher business formation rates. A recent announcement made by Ohio State University’s Fisher College of Business stated they support future startup efforts. The University has received a pledge of $17 million to develop a new entrepreneurship center. The state of North Dakota invested $17 million of public money in the Grand Sky infrastructure to add high-paying jobs for residents processing data collected by drones, maintaining drones
and piloting them, a necessary investment to build a new cluster. In 2017, Louisiana laid out an explicit strategic plan to cultivate “small business, innovation, and entrepreneurship.” The central effort is to work with both universities and economic developers to create a path for innovation in Louisiana. There are numerous creative policy initiatives underway in the American Heartland and the main body of this report discusses many of them.
End Notes
-
DeVol, R., Lee, J., & Ratnatunga, M. (2016, November). State Technology and Science Index Sustaining America’s Innovation Economy. Retrieved from https://assets1b.milkeninstitute.org/assets/Publication/ResearchReport/PDF/State-Technology-and-Science-Index-2016.pdf
-
Atkinson, R. D., & Wu, J. (2017, November). The 2017 State New Economy Index: Benchmarking Economic Transformation in the States Information Technology & Innovation Foundation. Retrieved from http://www2.itif.org/2017-state-new-economy-index.pdf?_ga=2.210333782.2113590904.1529337053-804273385.1527883765
-
West, G. (2017). Scale: The Universal Laws of Growth, Innovation, Sustainability, and the Pace of Life in Organisms, Cities, Economies, and Companies (9781594205583): Geoffrey West: Books. Retrieved from https://www.amazon.com/Scale-Universal-Innovation-Sustainability-Organisms/dp/1594205582
-
DeVol, R., Lee, J., & Ratnatunga, M. (2017, April). Concept to Commercialization: The Best Universities for Technology Transfer. Retrieved from http://www.milkeninstitute.org/publications/view/856
-
DeVol, R., Walton Family Foundation (2018, June 24). Incentivize Entrepreneurial Behaviors at Universities – Especially in the Heartland. Retrieved from https://www.waltonfamilyfoundation.org/learning/incentivize-entrepreneurial-behaviors-at-universities-especially-in-the-heartland